Flooding December 2013 - March 2014
Another wet winter
This graph shows the level of the Thames from 4th December 2013 to 8th January 2014. The red horizontal line is roughly at the level where water starts flowing out of the Thames across the land above Shiplake weir. The vertical scale is in centimetres.
Any level above -20 is likely to make access difficult along parts of Loddon Drive. In this case, waders or very large 4WD vehicles were needed from about 26th December. The water receded for a few days around new year, though some parts of the road remained wet.
On Monday 6th Jan, the level registered 25cm above the bank and a survey of the northern part of Loddon Drive showed water depths up to 54cm across the road. (This is almost at the limit of what a Range Rover with wading kit can cope with, moving very slowly.)
By Wednesday 8th Jan, the level registered 38cm above the bank of the Thames, so the depth across the road was probably about 67cm. This is deep enough to wreck almost all car-like vehicles and is dangerous to wade through because even a small current can cause you to lose your footing.
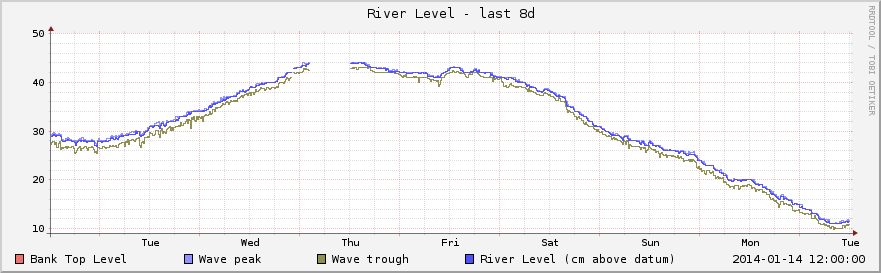
The level peaked at 44cm on Thursday 9th January 2014.
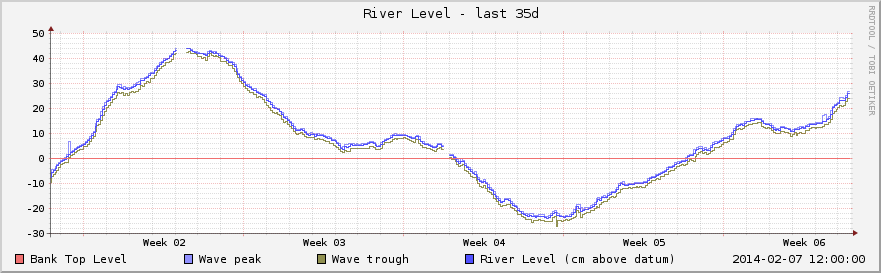
By Monday 13th January the level was 18cm over the bank. At this time there was still a lot of water under the railway bridge - enough to cover the raised walkway and to put water into the footwells of Land Rovers.
By Tuesday 14th January it had fallen to 11cm. At that time, the EA gauge at Twyford showed 2.52m and below Shiplake Lock the reading was 3.66m - all well above normal levels, but dropping. On Loddon Drive the maximum depth between Borough Bridge and the A4 was 30cm.
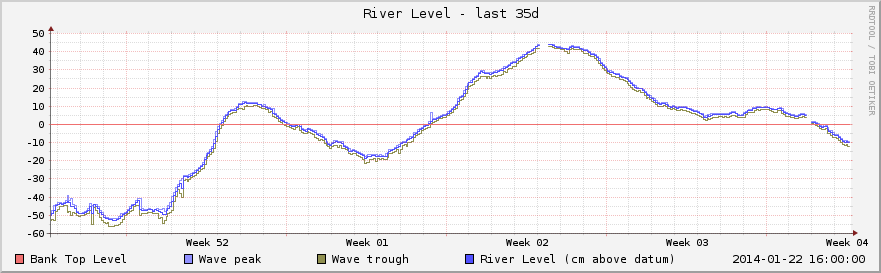
A lot of water was waiting upstream so it took quite a while for the level to drop back below the bank. On 22nd January 2014 the river was 10cm below the bank (0.41m on the EA gauge at Shiplake Lock, where the normal range is said to be between 0 and 0.31m). The Loddon was still 40cm above its normal range. At this point it was possible to use both ends of Loddon Drive in normal cars, though there was still about 15cm of water under the railway bridge so care was still needed.
Here is the graph for the 5 weeks 18th December 2013 to 22nd January 2014:
Rising again
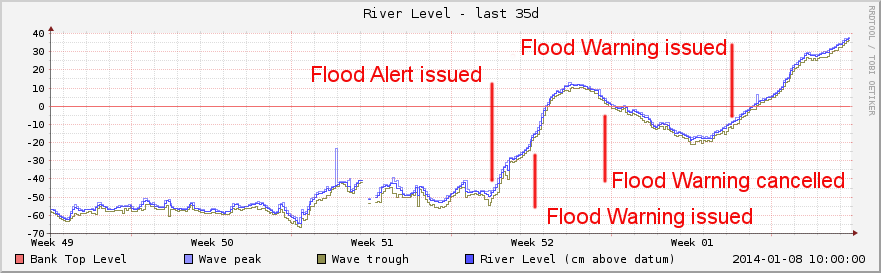
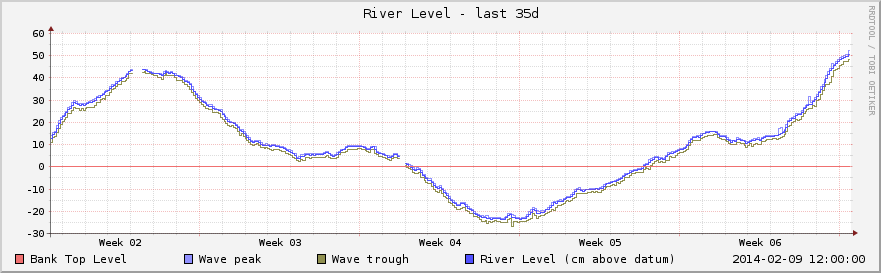
The Flood Alert from 23rd December did not get cleared, and by the end of January the river was rising again. On 2nd February we recorded 15cm above the bank, and there was 30cm across Loddon Drive between Borough Marsh Bridge and the A4. A new Flood Warning was issued at mid-day on 2nd Feb.
At 11:30 on 3rd February the Thames was 16cm above the bank, and water was 43cm deep on Loddon Drive between Borough Marsh Bridge and the A4.
At 11:30 on 5th February the Thames was 12cm above the bank, and water was 40cm deep on Loddon Drive between Borough Marsh Bridge and the A4.
At 11:30 on 6th February the Thames was again 16cm above the bank, and water was 44cm deep on Loddon Drive between Borough Marsh Bridge and the A4.
On 7th February the Thames was 27cm above the bank, and water was 60cm deep on Loddon Drive between Borough Marsh Bridge and the A4.
On 09:00 8th February the Thames was 40cm above the bank, and water was at least 70cm deep on Loddon Drive between Borough Marsh Bridge and the A4. The EA gauge at Twyford showed a new record high of 3.03m (previous record 2.83m). Gauging stations upstream were showing high levels, with many still rising. The level passed its earlier peak of 44cm by 16:00 and the water was still rising at 0.75cm per hour...
At 11:00 on 9th February the Thames was 51cm above the bank - still rising but very slowly. This is the highest we have seen for at least 10 years. The Loddon at Twyford was at 3.1m and the Thames was still rising at least as far upstream as Abingdon.
It took until mid-March 2014 for the river to drop back to normal levels. This was the longest flood event on Loddon Drive for decades, with some people being out of their houses for 3 months or more.
There was a lot of silt, and the ground in most places stayed wet for weeks. Some areas - such as Henley - were still suffering from groundwater flooding in basements at the end of April.
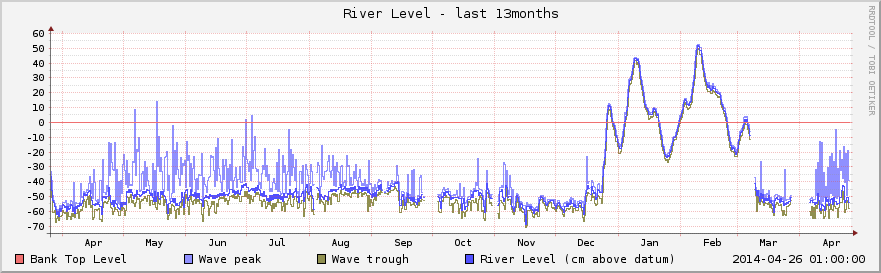
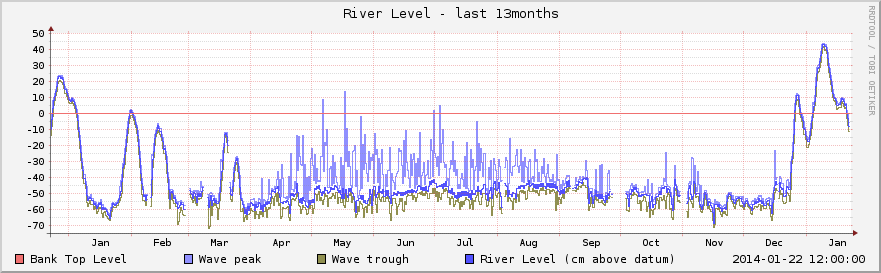
Looking back at 2013
In this graph you can see the series of flood events at the start of the year, followed by a long stable period from April to mid-December. We think that the apparently very high wave-peak readings in the summer months are caused by bats flying under the sensor: maybe they like the ultrasound chirps and want to be friends with it!